
Foreword
TLDR;
A lot has changed since I last wrote on this blog. Recently, a part of my team at Postman was laid off, and our main project was halted. It was a devastating experience for me, as it felt like abandoning a project I had dedicated myself to for a year and a half.
This isn't the first time I've faced such a situation. Reflecting on how I overcame similar challenges in the past, I sought ways to transform this negative energy into something positive.
Working on a cross-platform framework was immensely enjoyable and made me realize my passion for systems programming and macOS internals. However, I also recognized that opportunities to work on runtimes or frameworks are quite rare, and jobs focusing on macOS application are almost non-existent. I took a step back to evaluate my career and asked myself: "How can I find a more fulfilling direction for my research and work?"
So, I took a piece of paper and wrote down all the components that would make up my ideal job:
- Being in the systems programming side (no more web)
- Exploring macOS internals
- Research should be in the DNA of the job
This introspective exercise led me to the idea of exploring security for macOS application, as it perfectly intersects all my interests.
This long preamble is to explain that, moving forward, the focus of this blog will shift towards reverse engineering and macOS internals; essential pillars of my new journey.
Intro
As a starting point for this new journey, I decided to go through Advanced Apple Debugging & Reverse Engineering, originally written by Derek Selander. This post serves as a way to revise what I've read and as a reference for the future.
In this post, we will do an introduction to the usage of LLDB for reverse engineering. For the sake of this post, I will share with you a dummy application and our mission will be to crack the license.
By the end of this post you should be able to:
- Attach a macOS application to LLDB
- Inspect and lookup symbols (for debug build)
- Create breakpoints
- Modifying a register
Note: This post is not about attacking a real world application, but rather a pragmatic way to learn reverse engineering with LLDB.
I hope that you'll enjoy this journey!
Pre-requisite
Before moving on next step, you should double check that you have on your machine:
- Xcode installed and updated
- This application
To perform certain debugging and reverse engineering tasks on macOS, you might need to disable System Integrity Protection (SIP). SIP is a security feature that restricts the root user's abilities to modify certain protected areas of macOS. For educational and testing purposes, you can disable SIP on a virtual machine (VM) to avoid affecting your primary system's security.
Step 1: Attach your application with LLDB
Open your favorite terminal application and start LLDB.
lldb
Now you are in lldb. You should see something like:
❯ lldb
(lldb)
Now we need to create what we call a target:
(lldb) target create /path/to/CrackThelicenseDebug.app
In the LLDB debugger, a "target" refers to the executable file that you want to debug. Defining a target in LLDB involves specifying the path to the executable you intend to debug.
Now we can launch the process by running:
(lldb) process launch
Note: Alternatively, you can attach your application by using
lldb <path/of/your/application>orlldb -p <pid>and then runruncommand in LLDB.
The application should appear:
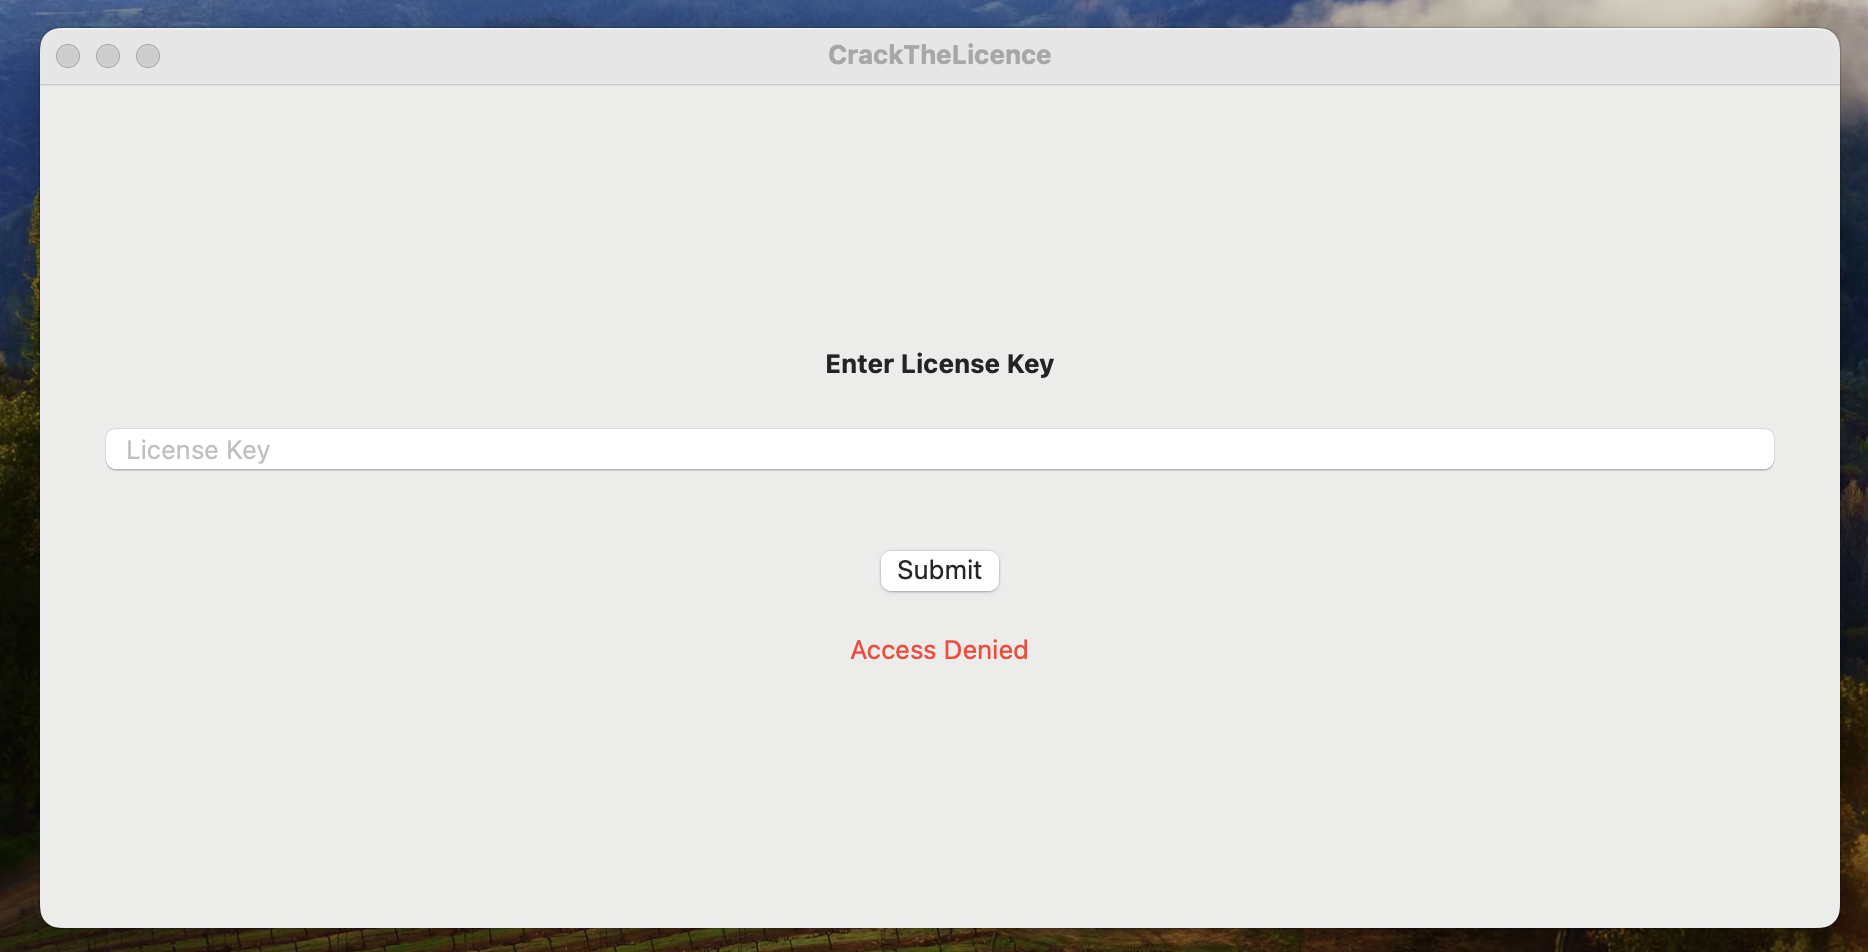
If you try to pass a random password you'll see the "Access denied" message. Let's see how we could work around this. (Note: by default the error message appears)
Step 2: Inspecting symbols
A breakpoint is a fundamental feature of a debugger that allows developers to stop the execution of a program at a specific point. By setting breakpoints, developers can inspect the code, the stack, and the registers at that moment. Breakpoints can be set at specific lines of code, on certain conditions, or when specific symbols are encountered.
Let's interrupt the execution of the application by pressing Ctrl+C. You should see something
like this:
Process 22605 stopped
* thread #1, queue = 'com.apple.main-thread', stop reason = signal SIGSTOP
    frame #0: 0x0000000181ae61f4 libsystem_kernel.dylib` mach_msg2_trap  + 8
libsystem_kernel.dylib`mach_msg2_trap:
->  0x181ae61f4 <+8>: ret
libsystem_kernel.dylib'macx_swapon:    0x181ae61f8 <+0>: mov    x16, #-0x30
    0x181ae61fc <+4>: svc    #0x80
    0x181ae6200 <+8>: ret
libsystem_kernel.dylib'macx_swapoff:    0x181ae6204 <+0>: mov    x16, #-0x31
    0x181ae6208 <+4>: svc    #0x80
    0x181ae620c <+8>: ret
libsystem_kernel.dylib'thread_get_special_reply_port:    0x181ae6210 <+0>: mov    x16, #-0x32
Target 0: (CrackThelicense) stopped.
(lldb)
Behind the scenes, it sends a SIGSTOP signal to the process. The execution has stopped in a system
call mach_msg2_trap, which is part of the libsystem_kernel.dylib shared library. We did this to
be able to use LLDB commands: we cannot add breakpoints during the execution of the program.
Now we'd rather stop the process when the application checks the license key. The first tool we could
use is image lookup, which "looks up information within executable and dependent shared library images.
Did you know that you can access LLDB documentation by running the
helpcommand. For instance, try to runhelp image lookupand see what it does!
By impersonating an attacker, you might try to look up symbols that contain words like "check" or "license"... Once we will have the symbol we would be able to set the breakpoint.
Let's try with "check" word:
(lldb) image lookup -rn check
I would totally understand if you'd rather close this tab and run away forever! But let's try to
explain what's happening here. When you run the image lookup command with the -rn flag, it
searches the symbol table for functions containing the word "check" across all libraries linked
to your binary.
Obviously, it is a nightmare to process this output. We know that we don't care about all the shared libraries; what we want is to look up symbols for the application itself.
Since you don't have access to the source code, we want to know all targets loaded. There's a
perfect command for this: image list:
List current executable and dependent shared library images.
On the top of the list you should be able to see:
[ 0] 1132E96C-BD61-35EF-BA0E-0D6C64B6C5A4 0x0000000100000000 /macos-lldb-reverse-engineering/CrackThelicenseDebug.app/Contents/MacOS/CrackThelicense
You could have deduced this CrackThelicense by looking at the folder structure, but image list is another
cool command to know :)
Now, we can use this library name to filter entries:
🎉 TADA! There is a match!
(lldb) image lookup -rn check CrackThelicense
1 match found in /Users/tonygo/Desktop/macos-lldb-reverse-engineering/CrackThelicenseDebug.app/Contents/MacOS/CrackThelicense:
        Address: CrackThelicense[0x0000000100005120] (CrackThelicense.__TEXT.__text + 5184)
        Summary: CrackThelicense`CrackThelicense.ContentView.checkLicense(key: Swift.String) -> Swift.Bool at ContentView.swift:41
Way more better. There is a checkLicense that seems to be what we were looking for.
Step 3: Setting Breakpoints and Modifying Execution
Now that we have the symbol, we can set a breakpoint.
(lldb) b CrackThelicense.ContentView.checkLicense(key: Swift.String) -> Swift.Bool
# Output:

Breakpoint 1: where = CrackThelicense`CrackThelicense.ContentView.checkLicense(key: Swift.String) -> Swift.Bool
    at ContentView.swift:41, address = 0x0000000100005120
A breakpoint number "1" has been created. Keep that in your mind for later.
Now we can proceed, and run the continue or c command:
(lldb) c
You can go to the application, type a random license key and click on the "submit" button:
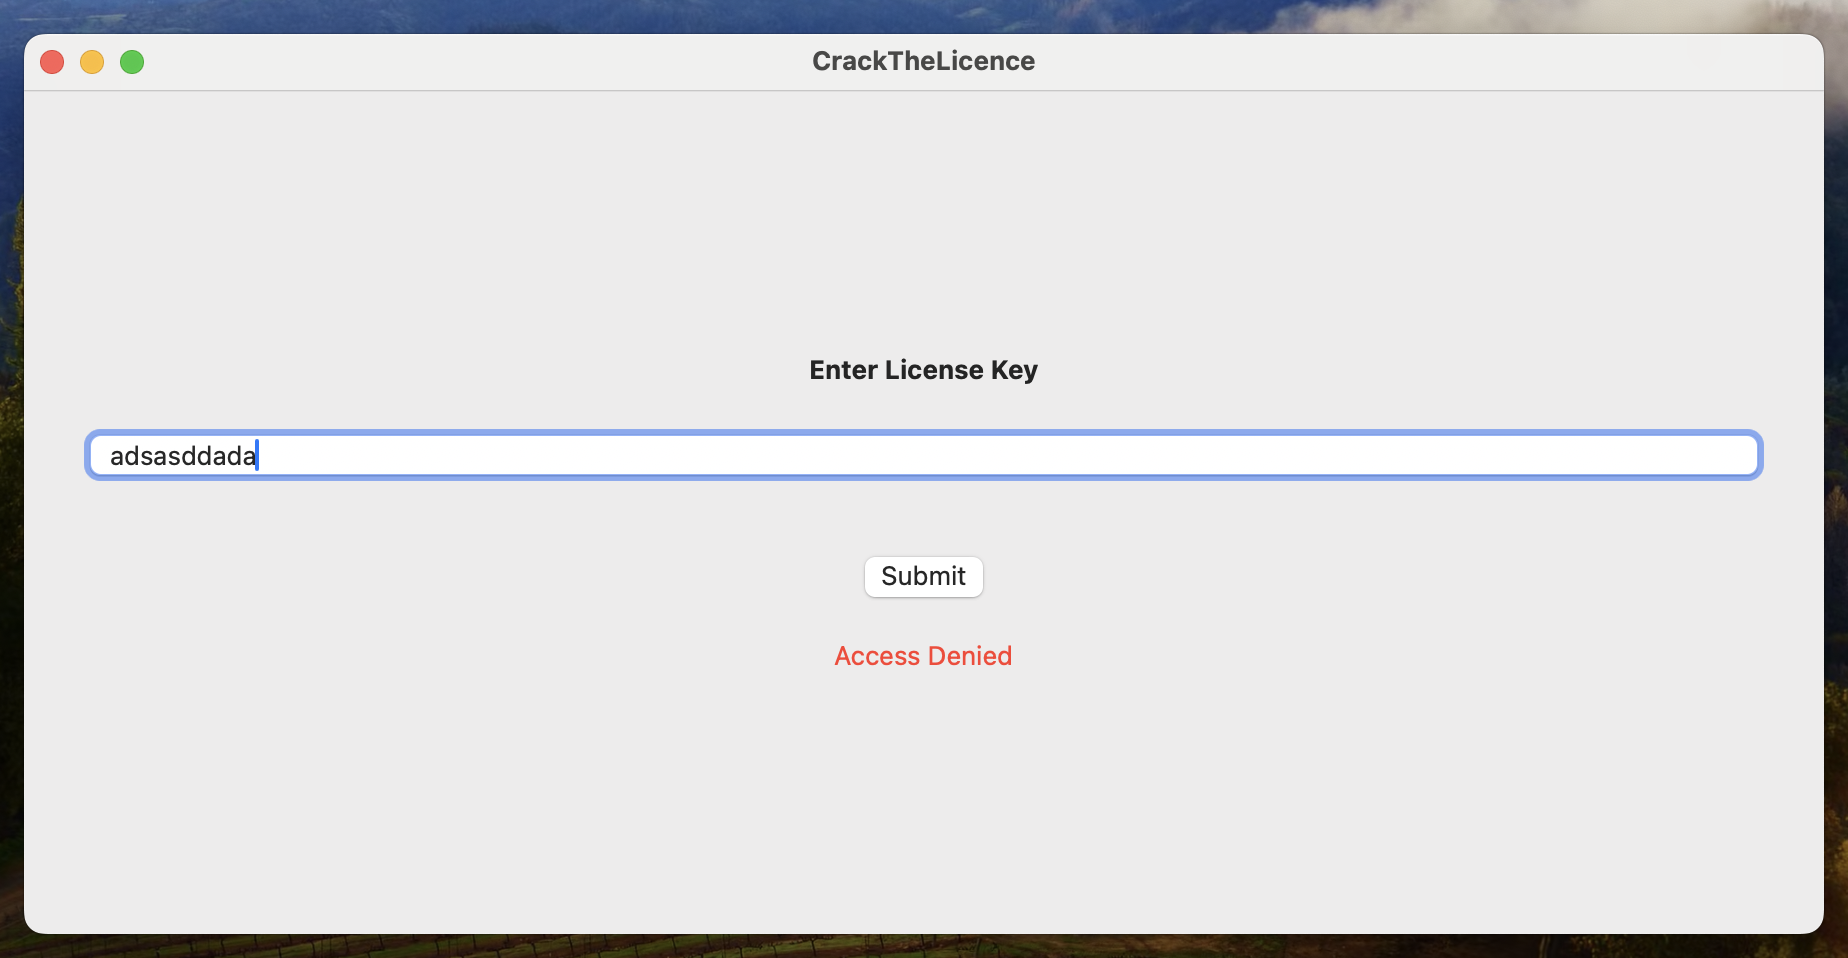
* thread #1, queue = 'com.apple.main-thread', stop reason = breakpoint 1.1
    frame #0: 0x0000000100005120 CrackThelicense` ContentView.checkLicense(key=Swift.String @ 0x000000016fdfde60, self=CrackThelicense.ContentView @ 0x00000001ccafac64)  at ContentView.swift:41
   38  	        .padding()
   39  	    }
   40
-> 41  	    func checkLicense(key: String) -> Bool {
   42  	        return key == "ABC123"
   43  	    }
   44  	}
Target 0: (CrackThelicense) stopped.
You can see that the breakpoint number 1 is hit (the one we created before).
Then, use the next (or n) command to step through the instructions:
You should see this:
(lldb) n
Process 8604 stopped
* thread #1, queue = 'com.apple.main-thread', stop reason = step over
    frame #0: 0x0000000100005160 CrackThelicense` ContentView.checkLicense(key="adsasddada", self=CrackThelicense.ContentView @ 0x0000600000f8ebd0)  + 64 at ContentView.swift:42
   39  	    }
   40
   41  	    func checkLicense(key: String) -> Bool {
-> 42  	        return key == "ABC123"
   43  	    }
   44  	}
Target 0: (CrackThelicense) stopped.
Do it again!
(lldb) n
Process 8604 stopped
* thread #1, queue = 'com.apple.main-thread', stop reason = step over
    frame #0: 0x0000000100005084 CrackThelicense` closure #1 in closure #1 in ContentView.body.getter(self=CrackThelicense.ContentView @ 0x0000600000f8ebd0)  + 164 at ContentView.swift:22
   19  	                .textFieldStyle(RoundedBorderTextFieldStyle())
   20  	                .padding()
   21  	            Button(action: {
-> 22  	                if checkLicense(key: licenseKey) {
   23  	                    accessGranted = true
   24  	                }
   25  	            }) {
Target 0: (CrackThelicense) stopped.
We reach the point where the function determines the return value. This is the time to modify the return value. Yes, we can do that with LLDB!
Step 4: Modify registers
The first thing to know is that you can inspect registers with the register command:
(lldb) register read
When you set a breakpoint and the execution halts in LLDB, the registers show the state of the CPU at that precise moment.
LLDB offers you the ability to modify these registers. For instance, if you want to modify the third
register to write the value 12 you can do:
(lldb) register write x3 12
There is a convention for ARM chips that dictates how functions receive parameters and how they
return values. For instance for arm64, when it comes to registers x0 to x7":
"Argument values passed to and results returned from a subroutine." (link)
In our context the first register x0 is used to store the return value.
x0 = 0x0000000000000000
As we typed a wrong license key, this is totally fine to have false aka 0 aka 0x00000000. But
as I said earlier with LLDB you can modify these registers:
(lldb) register write x0 1
Here you asked LLDB to change the value 0x to 1 aka true. Let's check that it worked:
(lldb) register read x0
      x0 = 0x0000000000000001
Now, if you press c/continue, the execution should resume and TADA 🎉:
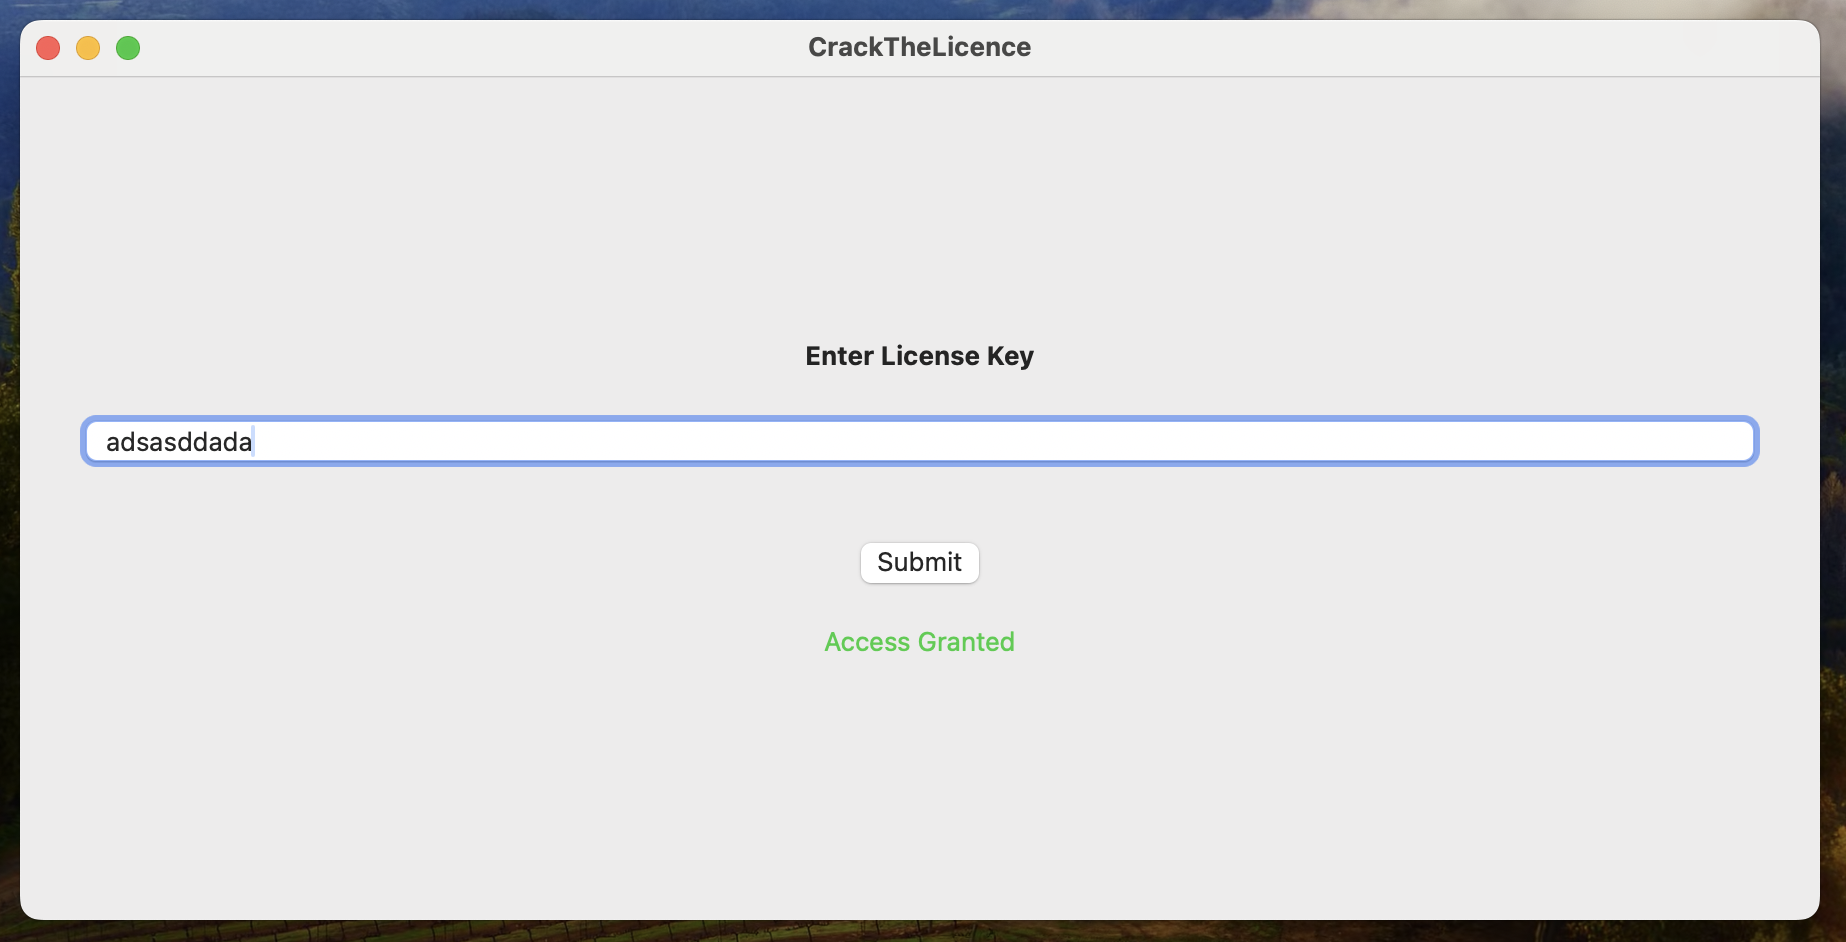
If you've made it this far, congratulations! You've successfully navigated through the world of LLDB, setting up breakpoints, inspecting registers, and even cracking a basic application's license.
As a next step, we could do the same but with a release build no?